This document can act as starting point for people who want to learn more about composite pipes in offshore applications, and is intended for engineers, Technical Authorities and managers active in the SURF, Subsea Intervention, Drilling and other related fields of activity.
Sign up for our newsletter
North America
- Region: Gulf of Mexico
- Topics: All Topics, Integrity
- Date: Feb, 2020
The discussions subjects covered in these postings are covered in my well integrity training courses. Go to www.internationalwellintegrity.com for more details. In this article I would like to comment on the issue of sand production and its measurement. This is a high-level view of the problem, representing the tip of the iceberg.
The technology of spectral noise logging is very powerful when in the right hands and can really provide a much direction in problem solving downhole issues. As a tool that listens for sound and does not transmit sound provides a more direct answer of downhole issues, simply relying on a pressure change OR sound of moving particles such as sand. BUT coming back to the issue of calibration, this critical element must be available, repeatable and transparent.
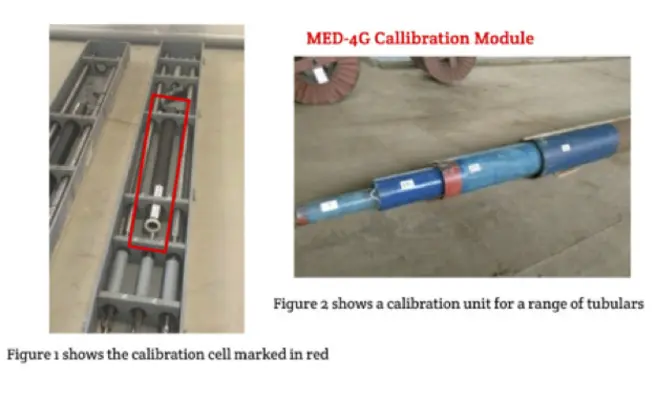
Your service provider should provide comprehensive details of calibrations and especially with dates, times and environmental conditions. Crucially, when calibrating the environment must be insulated from background noise, so having trucks thundering past, that vibrate and shake the work surfaces or having to tip toe past the calibration cell for fear of extraneous interference is not acceptable. But is something I have witnessed recently in one service provider facility, and questions the validity of the calibration and associated logging results.
Reviewing the service provider to ensure and validate their calibration process is key to success. Additionally, auditing of tool servicing and maintenance is crucial, especially as we are coming out of a downturn and cut backs have been severe.
Sand in the flow stream if not fully understood and correctly measured can be catastrophic. Therefore, knowledge of the sand source, the rate it is producing at and where in the well system it reaches when on production, provides a greater understanding of the problem complexity and how it might be mitigated.
A small checklist will help in the diagnostic process -:
1. Sand detection at the surface tells you straight away that you have a problem, but what is the rate of this sand production? How many pounds of sand per million standard cubic feet or thousand barrels?
2. Is the sand production rate dependant? If so, what is maximum rate the well can be produced at without sand at the surface?
3. Is there evidence in the surface equipment of sand? If so, try to sample and analyse and with a geologist determine where in the well is this coming from.
4. Measure wall thickness of elbows and compare to original construction dimensions to help measure the surface rate of metal loss
5. If an intervention is planned choose the logging company carefully, and only accept logging companies who can provide you with a numerical answer to the sand production rate. Just ticking a box to confirm its in the flow stream will not provide you with a full answer. You need to know the sand rate production versus well production rate.
6. Using slickline tools try to determine if the sump depth of the well has changed as this will suggest that the sand is dropping down the well and not all being produced to the surface.
7. Once the sand is better understood, you are then in a position to review, risk assess and determine a course of action that provides a working environment with an action plan if problems occur.
- Region: Gulf of Mexico
- Topics: All Topics, Integrity
- Date: Dec, 2019
By Simon Sparke – International Well Integrity
‘If you don’t monitor it you can’t measure it’, while this is probably fully understood, what is missing is ‘ensuring your measurement equipment is properly calibrated’, as a measurement is meaningless if the equipment response cannot be relied upon. As well integrity engineers, we need ONE source of truth and this must be reliable, repeatable and transparent.
Technology advances but are we missing something? In this digital age there seems to be less overall adherence to this critical task of calibration of downhole tools, even to the point where I have been told it was not necessary as the tool is self-calibrating which has the same amusement levels being told that gas wells have a bubble point.
Calibration is the act of comparing a device under test of an unknown value with a reference standard of a known value and in so doing, provides us with the means to determine the error or verify the accuracy of the device under test.
As well integrity engineers, one of our concerns is the status of the well tubulars through the field life, so that we need to understand the sources or causes of sustained annulus pressure and the location(s) of metal loss over and above that of allowable metal loss during manufacture. The change in wall thickness will help determine the MAASP or MAWOP and how this impacts the well operating status.
I use the phrase ‘metal loss’ as this is important. Pipe wall thickness variations occur for several reasons; manufacturing tolerance, wear caused by interventions, erosion, and corrosion. These various attributes need to be understood by any analyst including the logging company and form part of a rational discussion about well status and the causes for change.
A range of tools are available to help determine remaining wall thickness in our well tubulars. These include -:
· The multi fingered caliper measures the internal status of a single tubular; recording metal loss due to corrosion but also recording wall thickness gains such as scale(s), paraffins and asphaltenes.
· Electro magnetics, can make measurements of multiple tubular strings in a single logging pass and these tools are NOT influenced by scale, paraffin or asphaltenes
· Sonic based tools can measure wall thickness and surface tubular status but can only record a single string and require a liquid filled environment
· Cameras now provide a comprehensive ‘view’ of the tubular and the associated completion jewellery but can only measure a single tubular string.
How do we move forward and who or what do we believe? As well integrity requires rigorous charted, signed and witnessed pressure tests on much of our pressure control equipment, then surely it is correct for logging tools etc to be subject to a similar test(s) in order to qualify their effective readings, especially as the results could have an impact on well integrity and the safety of our colleagues. The data required should include; pipe size(s), weight, wall thickness and metal grade. It should be signed and dated. Review this calibration before logging starts and ensure it passes the ‘sniff test’. Therefore, if the service provider cannot or will not support their reports with repeatable calibration data, we must question their standards.
What must be used are the allowable wall thickness variations in the tubular manufacturing process. Two key documents are available; API-5CT for regular tubing and casing (OCTG) provides for a variation in wall thickness of -12.5%
API-5CRA for corrosion resistant alloy tubulars provides for a variation in wall thickness of -10.0% OR -12.5% which is driven by the heat treatment process.
To piece all this together and provide a meaningful result, several elements are needed. These include; logging results, API wall thickness tolerance, completion design + the well production characteristics + well history and a degree of common sense. However, and most crucially, calibration data is very important.
The pictures below show tools to measure metal loss in multiple tubing/casing strings. Operators use this data to determine well status, re-calculate MAASP and if/when a workover might be required to replace strings.
Setting a good industry example. My belief is that we should have similarly high expectations of service providers and they should demonstrate tool calibration as shown in the picture below. This company, Ginnovo, sends tools to the wellsite complete with a calibration cell. This provides the opportunity to confirm the accuracy of the collected data, while still in the field. It withstands scrutiny and demonstrates the appropriate level of professionalism that we as responsible companies should demand. If they can’t deliver, then my recommendation is to seek alternative providers and in this field there are several.
- Region: Gulf of Mexico
- Topics: All Topics
- Date: Jul, 2017
Introduction
The optimum design for offshore wells is one that requires minimal intervention work from the beginning of production to P&A operations. The only intervention that is generally acceptable is wireline work. Operators would prefer to avoid interventions, but even the best thought-out plans and designs may not perform as expected over the life of a well. Furthermore, there is a large inventory of producing wells that will require some form of intervention. With technological advances, many interventions can be done without the need of an expensive offshore rig by using coiled tubing and wireline. Using these deployment methods, operators can run many mechanical tools to correct problems and bring a well back on production. In some instances, however, a mechanical option may not be possible due to restrictions in a wellbore. In that case, inflatable tools can be used to help implement the needed solutions. Some examples of situations benefiting from inflatable tools are:
- Plug-Back Operations
- Squeeze Cementing
- Repair of Leaks
- Setting of Temporary Barriers
- Well Integrity Testing
This article will highlight the typical inflatable products and their uses. Case histories will also be included.
Download Attachments: Download PDF 
- Region: Gulf of Mexico
- Topics: All Topics
- Date: Sep, 2019
Wellbore deformation can occur at any stage in the life of a well. Whether a result of changes in temperature, pressure or tectonic forces, wellbore deformation may result in serious downhole issues such as restricted access for interventions or the loss of well integrity, and could ultimately lead to premature well abandonment.
With no symptoms presented at surface, operators often discover deformation issues the hard way – during interventions. However, proactive diagnosis of well deformation enables operators to understand the cause and severity of the issue, enabling them to adjust their strategy and overcome it before a critical stage is reached.
EV’s 24 arm Integrated Video Caliper was deployed on e-line to help identify the cause of the hold up. The IVC tool combines industry leading Optis camera technology with multi-finger caliper technology to provide measurements of internal tubing and casing diameters.
This combination of video with multi-finger caliper data leads to enhanced interpretation and provides invaluable 360° pipe coverage to compliment the limited radial coverage available from a stand-alone mechanical caliper.
The liner top was inspected and a full 360-degree 3D model was provided. No visible signs of damage were identified and the geometry was confirmed to be normal. However further up the casing, the caliper data processed on MIPSPro indicated that the casing was helically buckled above the liner hanger.
Further RestrictionVA analysis was carried out based on data obtained from the multi-finger caliper. Firstly, a Pipe Deformation Analysis (PDA) was undertaken to define and quantify the 3D geometry of the tubulars that may have been sheared, buckled or deformed by other mechanisms. This process confirmed the presence of helical buckling in the casing and the reason why the original plug and perf string was unable to descend to the target depth. Then, by simulating the passage of multiple BHAs through this 3D geometry, a drift analysis was provided to understand the limits for access and identify the optimal BHA to pass the restriction.
Page 5 of 5