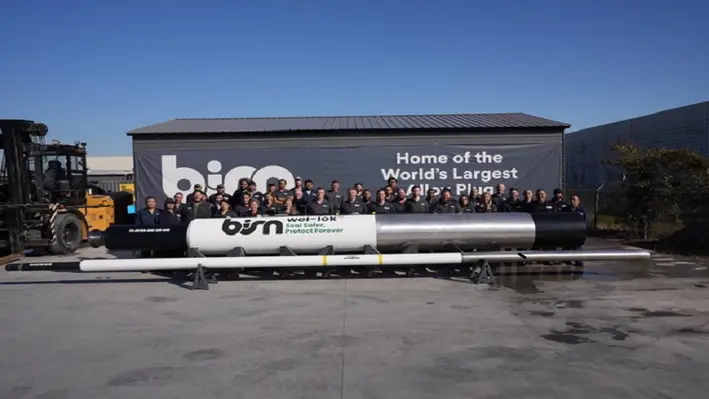
BiSN, a leading supplier of downhole sealing solutions and technology, has set a new record for the largest bismuth plug after a recent deployment in the Gulf of Mexico.
A permeant, gas-tight seal was required for a well with a 36” OD that was experiencing gas migration. To seal a well of that size, BiSN scaled its Wel-lock technology and operations to meet the needs of both the size of the tool and the production timeline requested by the operator.
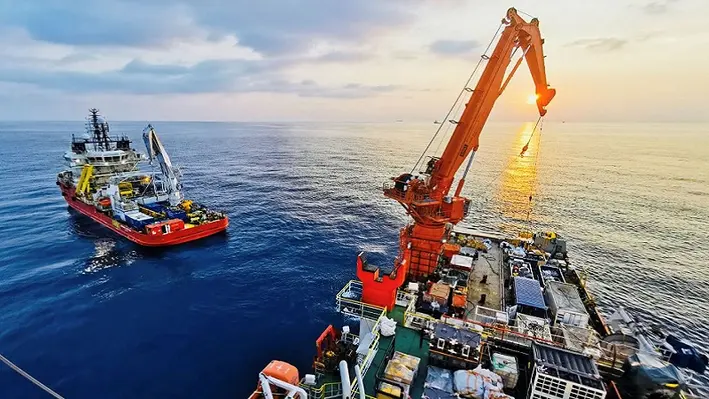
As the well had already been sealed with cement but was still experiencing gas migration, BiSN needed to deploy its Wel-Lok technology without using a rig. An innovative deployment method was applied using a liftboat and remote operated vehicles (ROV) to guide the tool into place.
Once the tool was activated, the bismuth alloy flowed and solidified, filling and sealing the cross section of the conductor pipe in less than an hour.
“The success of this tool really speaks more about the flexibility and varied applications of BiSN’s Wel-lok technology, the size is just part of the story,” said Paul Carragher, CEO of BiSN.
“By utilising BiSN’s technology, we ensured a permanent seal giving the supermajor operator peace of mind, saving them time as we were able to deploy from a liftboat and costs as a rig wasn’t necessary. We have now completed over 400 deployments worldwide with BiSN’s Wel-lok technology gaining significant momentum and I’m excited as we continue to expand the range of applications for which the technology can be used, as well as BiSN facilities and people worldwide to support the growth.”

Next-generation leader in geothermal technology, Fervo Energy, has announced a US$10mn strategic investment from Devon Energy Corporation in order to initiate a partnership between the two companies and apply Devon’s 50-plus years of innovation in oil and gas to Fervo’s advanced geothermal capabilities.
Co-founder and CEO of Fervo, Tim Latimer, said, “We are thrilled to have Devon as a partner. Devon is a technology leader with historic and unparalleled expertise in drilling and completing wells. We expect this partnership will help unlock further potential for geothermal as the primary 24/7 renewable energy source.”
“We are excited about this partnership with Fervo, and innovator and leader in the enhanced geothermal space,” commented David Harris, chief corporate development officer and executive vice president, Devon.
“This investment is a good match for Devon’s new energy ventures strategy.”
Fervo applies horizontal drilling, multi-stage well completion and distributed fibre optic sensing to geothermal reservoir development, delivering higher reliability on projects. Fervo’s approach makes geothermal power accessible in far more places than before and increases its potential as a widespread energy source.

Geothermal Technologies (GTI), a company dedicated to developing clean energy, has filed for drilling permits with the Division of Water Resources in the State of Colorado, US.
GTI is seeking to drill geothermal wells for the purpose of generating utility-scale electricity in the Denver-Julesburg (D-J) Basin. GTI’s proprietary GenaSys Geothermal Energy Harvesting System ushers in the latest generation of geothermal technologies. When coupled with advanced Organic Rankine Cycle (ORC) power generation technology, GTI’s innovative system enables the efficient extraction of geothermal energy in geographic regions around the globe that have been out of reach using conventional approaches.
“This is an important step forward in our plans to construct a first-of-its-kind geothermal power plant in the D-J using GTI’s proprietary suite of technologies,” said J. Gary McDaniel, CEO of GTI. “We are excited about the potential that exists in Colorado for the development of advanced geothermal power. GTI has calculated that the thermal prospect in the DJ Basin has over 5GW of geothermal energy that can be harvested using our technology. Our field development plan for generating power indicates we can install up to 400MW of baseload electricity production.”
Jim Hollis, President and COO of GTI, added, “Our GenaSys technology promises to make geothermal baseload power both low in cost and truly scalable – locally, regionally, and globally. We plan to begin by constructing a small 5MW power plant in the D-J basin and then scale from there.”
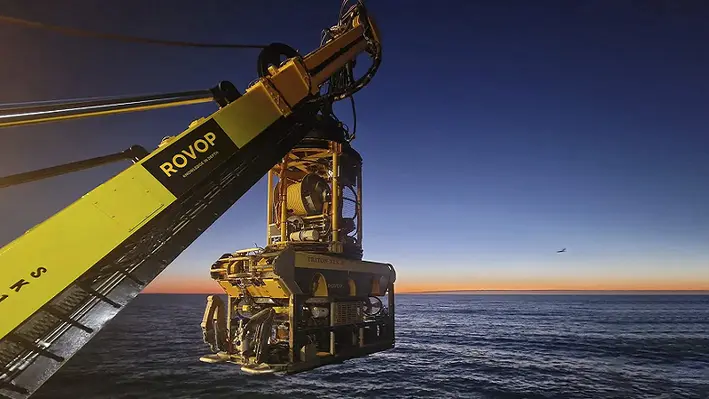
ROVOP, a large independent remotely operated vehicle (ROV) solutions provider, has announced a US$25mn senior secured credit facility with Cordiant Capital (Cordiant), a specialist global infrastructure and real assets manager.
Backed by global private equity firm Bluewater, ROVOP is known for providing its customers with best-in-class equipment and services and is a long-term and trusted partner to blue-chip customers in all key offshore sectors.
Cordiant will support ROVOP with investment into its fleet infrastructure and employees. This will allow the business to continue capitalising on highly favourable offshore market dynamics by securing new contract wins across both new build construction, decommissioning, surveillance, and maintenance services.
Neil Potter, CEO ROVOP, said, “ROVOP is seeing record demand for its services, and Cordiant’s investment means we’re better placed than ever to take advantage of increasing international demand for subsea robotics in both renewable and traditional energy sectors. This investment solidly positions ROVOP for further growth as we continue to invest in our fleet and our people.”
Stephen Foss, Co-Head Energy Transition Infrastructure at Cordiant Capital commented, “ROVOP is a company with great momentum and we’re excited to be supporting them on the next stage of their growth journey. We firmly expect infrastructure service providers like ROVOP to continue thriving as the desire to develop autonomous, low-cost based means of power generation and expansion of digital communication as they continue to grow in importance.”
InterMoor, a brand in Acteon’s engineering, moorings and foundations division, has been awarded a decommissioning contract by Chevron Thailand Exploration and Production (CTEP).
Following InterMoor’s completion of Phase 1 decommissioning work in 2021 in the Gulf of Thailand, CTEP has extended InterMoor’s field decommissioning contract by adding more packages for the disconnection and removal of pipelines.
InterMoor’s scope of work after the extension includes project management engineering, procurement and offshore execution; disconnection and removal of pipelines; disconnection and removal of single point mooring (SPM) and associated subsea infrastructure; and topside modifications work.
InterMoor will use cutting tools provided by its sister company, Claxton. Aquatic will provide subsea umbilicals, risers and flowlines (SURF) recovery equipment and UTEC plans to provide the survey spread.
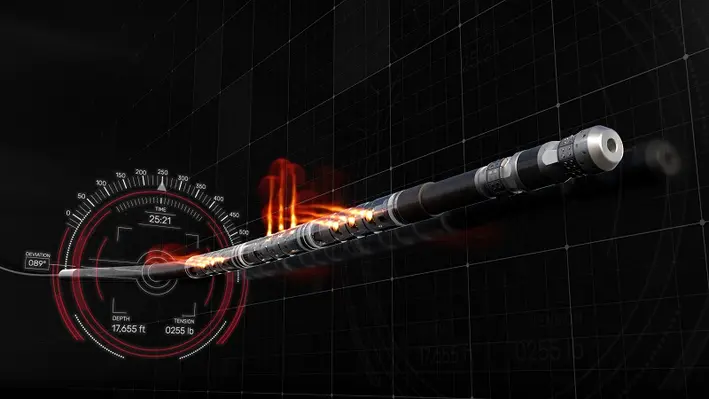
Halliburton, a leading provider of products and services to the energy industry, has announced the implementation of the Auto Pumpdown service within the company's hydraulic fracturing business which enables wireline and pump automation during unconventional completions operations.
The Auto Pumpdown service controls fluid pumps and a wireline unit as a single, fully automated, closed-loop system to maximise Halliburton’s plug and perforating performance and efficiency. The system executes operations to plan and optimises equipment operation for improved consistency.
The service enhances operations by automating tasks previously prone to human inconsistencies and reduces risk by providing prompt feedback to dynamic downhole conditions. These improved consistencies create more efficient operations and reduce required fluids for tool conveyance.
Chris Tevis, Vice President of Wireline and Perforating, Halliburton, commented, “Halliburton’s Auto Pumpdown service ushers in a new era of intelligent plug and perf operations that reduce risk while redefining the level of efficiency and consistency we provide our customers. The service reinforces our leadership in unconventional perforating services by minimising variability in operations, which helps avoid unnecessary and costly well interventions and simultaneously improves efficiencies.”
Multiple perforating crews in North America currently use Auto Pumpdown service. Here, it has demonstrated improved operating efficiencies, reduced fluid requirements, and reduced risk of unnecessary well interventions.
Halliburton will implement Auto Pumpdown service on its North America fleet through 2023 and beyond.
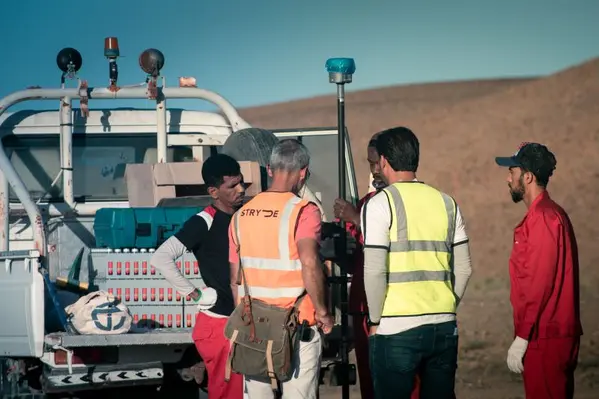
Onshore seismic acquisition and imaging experts, STRYDE, has enabled five new geothermal projects in Q1 of 2023 with the supply of its low-cost seismic technology, with a further five contracts for scheduled to commence during Q2.
The global contracts, equating to a six-figure sum, will see the company’s technology deployed across the US, Middle East and Europe.
Two of the ten contracts include nodal equipment supply and seismic data processing for STYDE’s largest geothermal project to date in the Middle East, as well as a European survey that was constructed alongside a geological research centre in Belgium. Five of the seismic surveys have already commenced, and all ten are expected to be completed by the summer of 2023.
Nick Tranter, STRYDE’s Business Development Manager for New Energy, said, “Within the renewable energy space, STRYDE presents a cost-effective and reliable solution to help geothermal operators de-risk investment decisions, with high-resolution seismic data.”
Mike Popham, STRYDE CEO, commented, “I am proud to have STRYDE play a part in supporting the energy industry transition towards net-zero. Our technology has proven to be a key tool in propelling more than 20 geothermal projects to date, by providing an economically viable solution for understanding and monitoring the subsurface.”

Neptune Energy has announced an agreement to create new ‘digital twins’ of two offshore platforms in the Dutch North Sea, expanding its portfolio of digitised assets to 14 in total.
The twins will enable engineers to carry out traditional offshore work from an onshore location, accelerating work schedules and reducing costs. UK-based 3D technology specialist, Eserv, will digitise the Neptune-operated D15-A and K12-C platforms, after previously creating digital versions of 12 platforms in the Dutch and UK sectors.
This technology allows Neptune teams to virtually visit assets, leading to thousands of hours of work being completed from office-based locations since the twins were introduced.
Neptune Energy’s Director of Operations for the Netherlands, Stephane Lacote, said, “The use of 3D technologies such as digital twins have provided significant benefits including reducing operational costs by enabling traditional offshore activities to be completed quickly and efficiently, without travelling offshore.
“Our engineering teams can now virtually visit platforms to support the safe running of operations from anywhere on the planet.”
Digitising operational assets to improve safety and productivity, as well as reduce environmental impacts, supports Neptune’s aims to enhance asset integrity and provide employees with technologies that support collaboration with colleagues globally.
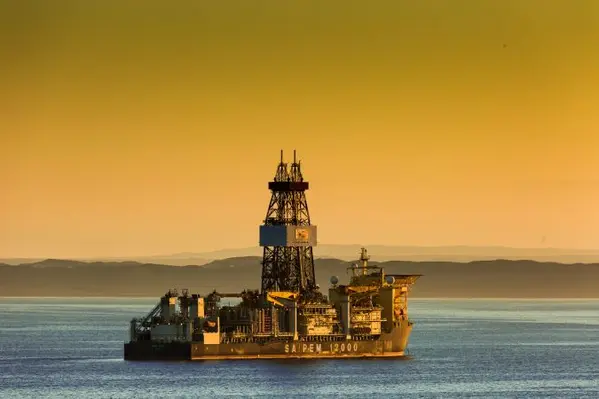
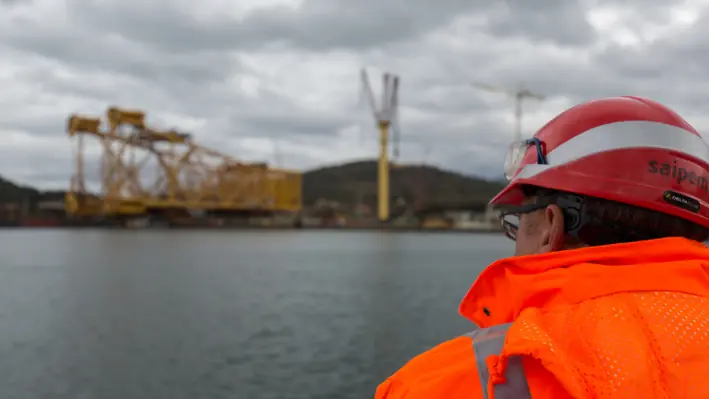
Saipem has been awarded three new offshore contracts along with two competitive FEED contracts totalling approximately US$650mn.
The first of the contracts was assigned by Azule Energy for the Agogo Full Field Development project – a deepwater greenfield development approximately 180 km offshore Angola. The contract encompasses the Engineering, Procurement, Construction and Installation (EPCI) of rigid Pipe-In-Pipe flow lines with associated subsea structures. Saipem will mobilise its state-of-the-art offshore installation vessel FDS2.
The second contract was awarded by EnQuest for the decommissioning of existing infrastructures in the Heather oil field located in the UK sector of the North Sea, around 460 km northeast of Aberdeen. Saipem will carry out the engineering, preparation, removal and disposal of the upper jacket of the Heather platform, utilising the semisubmersible crane vessel Saipem 7000.
The third contract was issued under the Aramco LTA programme in Saudi Arabia, where Saipem will execute the offshore EPCI of one platform topside and the associated subsea flexible, umbilical and cable system.
Additionally, Saipem has been awarded two Front-End Engineering Design (FEED) Competition contracts for gas developments projects. The first one, assigned by Shell Trinidad & Tobago Ltd., is related to the development of the Manatee natural gas fields. The other contract concerns the development of the upstream facilities to feed the natural gas PAPUA LNG project in Papua New Guinea.
All of the above further consolidates Saipem’s position both geographically and in key segments for the offshore business, in particular in decommissioning where the company boasts an impressive track record.
Archer has announced the completion of the Baker Hughes’ UK Coil Tubing and Pumping business acquisition made in February 2023.
Dag Skindlo, CEO of Archer, said, “This acquisition is part of our strategy to be one of the leading well services companies in the UK. Together with our well-established platform operations business, Archer is uniquely positioned to serve our customers with a broad range of production enhancements and P&A operations. We are pleased to welcome this highly skilled and experienced team to Archer and look forward to adding value to existing and new customers.”
Following new developments to the Decommissioning and Abandonment Australia 2023 programme, Offshore Network has released a revised agenda.
More than 250 decommissioning experts are expected to attend this year’s D&A AUS conference, being held at the Duxton Hotel, Perth, from 30-31 May. As the country’s largest decommissioning summit, attendees will receive unique access to updated regulatory guidelines, innovative technologies and valuable lessons which contribute to the success of upcoming campaigns.
With the forthcoming decommissioning wave more visible than ever, D&A AUS 2023, like its predecessors, will serve as a meeting point for the industry to get ahead of the challenge and unlock the opportunities held within. Now, there is more incentive to join the community in Perth this year, with new presentations and tech displays added to the agenda.
Notably, Craig Baxter, Decommissioning Technical Manager from Claxton Engineering will present on innovation and collaboration in underwater laser cutting, allowing attendees to access insights into the tools capabilities and understanding of where the technology can be utilised best.
Visitors will now also be looking forward to a presentation from Richard Bazen, Sales Director of Energy from RemSense. At the conference, Bazen will look at mitigating the risk of HSE and decommissioning liabilities using photogrammetry based digital twins. With the digital age firmly upon us all, this is one session not to be missed.
Offshore Network has now announced additional facets with AF Offshore Decom presenting and Trident Australia exhibiting at the conference. Furthermore, the organiser has revealed group bookings from Woodside, Santos, Weatherford, Mann Group, Tetra Tech and more.
Find all relevant information and the agenda in the brochure here: https://offsnetevents.com/da-aus/
Or contact:
Erin Smith
Global Accounts & Australasia Regional Manager
Offshore Network Ltd.
t: +64 (0) 3 569 3074 | e:
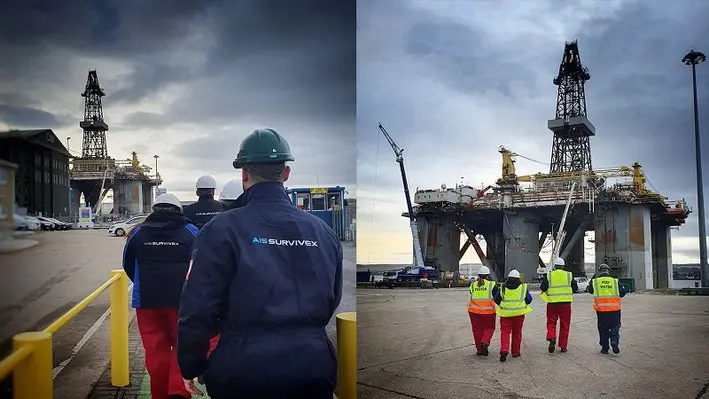
The team of AIS Survivex, an offshore training provider in the UK, has received an insight into life on board a decommissioning rig courtesy of Well-Safe Solutions.
Members of AIS Survivex were invited on board the Well-Safe Defender to let them experience life on a bespoke well plug and abandonment semi-submersible rig which accommodates 110 energy workers. It was described as an enlightening experience which allowed the team to understand more about the working conditions and challenges for the people they help train. AIS Survivex has been delivering and managing all training for Well-Safe since 2019 and is currently carrying out a range of training to prepare the Well-Safe Defender’s crew for its forthcoming campaigns.
The rig itself used to be used for drilling operations in the North Sea but, since being taken into Well-Safe’s ownership in 2022, has been converted to play a part in the energy transition as a bespoke well decommissioning asset. Currently, the rig is undergoing a host of efficiency enhancements ahead of its mobilisation this month for a well P&A campaign with Spirit Energy on the Trees and Chestnut fields.
laire Adams, Training and Competency Advisor at Well-Safe Solutions, commented, “With over 360 staff working for Well-Safe Solutions, we are focused on safe, smart and efficient delivery of well plug and abandonment – and all of this begins with effective training. AIS Survivex have supported Well-Safe Solutions on multiple occasions by providing multi-skilled trainers to provide rig-based training on all our assets as part of our rig readiness plans.
“Two AIS Survivex multi-skilled trainers were delivering a suite of courses to our crew onboard the rig to enhance personnel and team compliance against our matrix. The input of the AIS Survivex trainers is paramount in ensuring the relevant Well-Safe Solutions personnel held the correct training certification to ensure operational compliance prior to the rig mobilising for its upcoming P&A campaign with Spirit Energy. Collaborative working is key to our success and a safety-first mentality is critical for offshore workers.”
Page 75 of 122